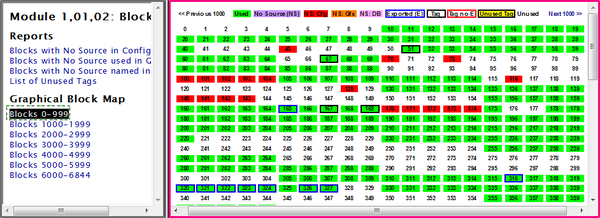
The Graphical Block Map can be accessed by either:
- Clicking Block Map in the Module Index, and selecting the block range of interest under the Graphical Block Map heading.
- Right-clicking on a block, and selecting Go To Block Map. This will automatically take you to the Graphical Block Map Index for the selected Module.
- In the Watch Window, right-clicking on an item in the Block List and selecting Go To Block Map.
The Graphical Block Map is a graphical overview of block usage, showing configuration aspects and issues at a glance. The blocks are presented as a color-coded table indicating whether each block is used, tagged, has a source, and other similar information. Every block in the Graphical Block Map is linked to its Block Use Index, which lists each place it is referenced in your INFI 90 system.
The Graphical Block Map allows you to see where blocks are available for insertion of a large function code.
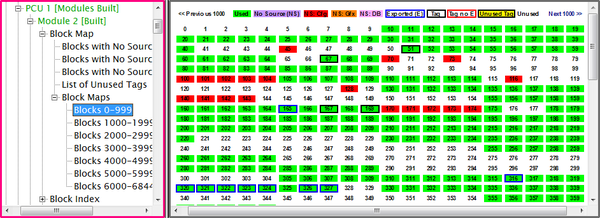
This same selection in Treeview format will look like this:
Explanation of the Graphical Block Map color legend:
| This block is used. | |
| This block does not have a source, but is used somewhere in the system. | |
| This block is used in configuration but the source does not exist (or has not been built.) | |
| The block is used on a graphic, but not sourced in configuration. | |
| This block is referenced in a database, but not sourced in configuration. | |
| The block is exported, but not tagged. | |
| The block is tagged and exported. | |
| The block is tagged but not exception reported. | |
| The block is tagged, but unused. | |
| The block is completely unused. |
Ideally, what you want to see for your blocks is this:
![]()
This block is green with a black border, indicating that it is tagged, exported and used.
See also
- Going to the source of a value
- Linking to Documents Outside the Watch Window
- Highlighting the signal lines associated with a block
- Showing the tree of ancestors for a block visually (Input Tree)
- Showing the tree of descendants for a block visually (Output Tree)
- Module Block Index (all blocks used within a module)
- Module Header
- Module Reference Index
- Module Variable Index
- Module Verify File
- Module Block Map
- Module: Blocks with No Source in Configuration
- Module: Blocks with No Source used in Graphics
- Module: Blocks with No Source Named in Databases
- Module: List of Unused Tags
- Module Tag Index
- Reference Index
- Module:List of Unconfigured Tags
- Module:List of Unused Alarm Tags
- Module Index