Specifying the horizontal resolution of a plot
You can specify the horizontal resolution of the plot display by entering a number in the Plot Resolution box and clicking the Apply button or pressing the Enter key. The default value is 1.000 sec/pixel. This value specifies how many seconds of data are to be displayed in each horizontal pixel. For a "zoomed in" view of data, choose a value less than one. It is also possible to get a overview of data by entering a larger value, for example 60 to show one datapoint each minute.
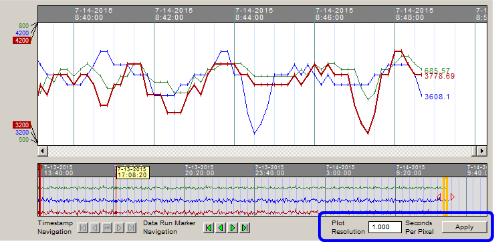
Plot Resolution set to 1 second/pixel:
This means the Watch Window will display 1 second of data per pixel in graph.
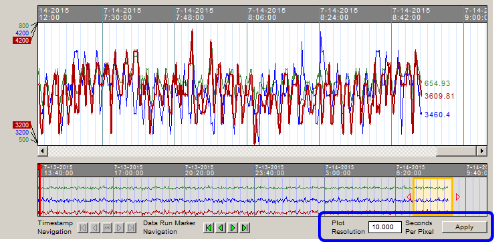
Plot Resolution set to 10 seconds/pixel:
This means the Watch Window will display 10 seconds of data per pixel in the graph.
![]() Note: When there is more data than can be displayed on the plot, for example if data was collected once a second, but displayed at 10 seconds/pixel, every tenth datapoint would be displayed. Use caution when using values for Plot Resolution that are higher than the update interval. In future releases, a "data-smoothing" mode will be supported where multiple datapoints slated for display in the same pixel will be averaged when displayed.
Note: When there is more data than can be displayed on the plot, for example if data was collected once a second, but displayed at 10 seconds/pixel, every tenth datapoint would be displayed. Use caution when using values for Plot Resolution that are higher than the update interval. In future releases, a "data-smoothing" mode will be supported where multiple datapoints slated for display in the same pixel will be averaged when displayed.
Specifying the vertical resolution of a plot
To expand a Watch Window plot vertically, edit the block, select Specify Range in the Live Data Options For This Block dialog, and enter a smaller range into the associated boxes. The Watch Window will also automatically specify the range if Autoscaling is enabled.
See also
- Viewing the Watch Window as one plot or split plots
- Stopping the plot from scrolling in the Watch Window
- Inverting the y-axis of plots in the Watch Window
- Showing/Hiding a plot line in the Watch Window
- Automatically generating the best range for plots in the Watch Window
- Understanding when data points are connected with lines in trend plots
- Changing plot line colors in the Watch Window
- Changing the update interval for blocks and groups in the Watch Window
- Controlling Data Display in the Watch Window
- Preventing pink-colored out of range data from appearing on Watch Window plots
- Navigating Watch Window data with the Navigation Timestrip
- Setting a plot display start time
- Setting the plot font size