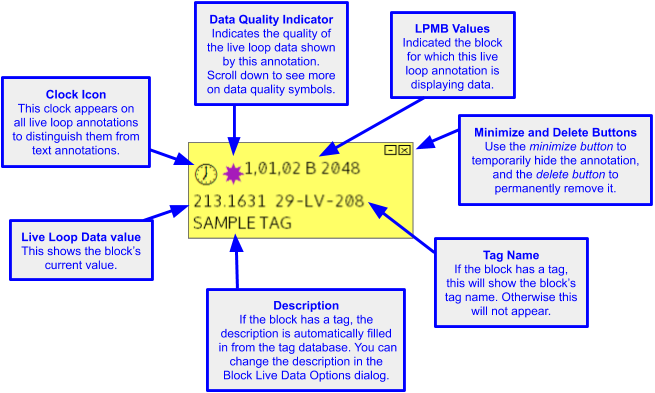
Simple annotations showing live data
Annotations showing dynamic bars
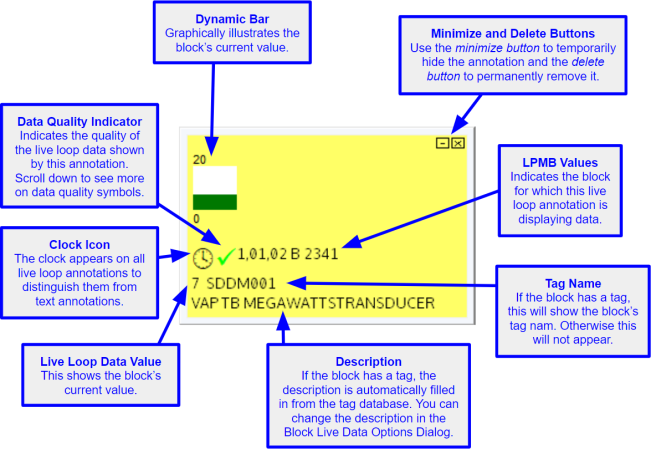
You can use the Live Data Options For This Block dialog to decide whether you want to show a dynamic bar on any live loop annotation.
Annotations showing live specs
![]() Note: As of DBDOC 11.1, live specs are now shown directly on layered specs, instead of on live loop annotations. For more information, see Enabling fetching and display of live spec values.
Note: As of DBDOC 11.1, live specs are now shown directly on layered specs, instead of on live loop annotations. For more information, see Enabling fetching and display of live spec values.
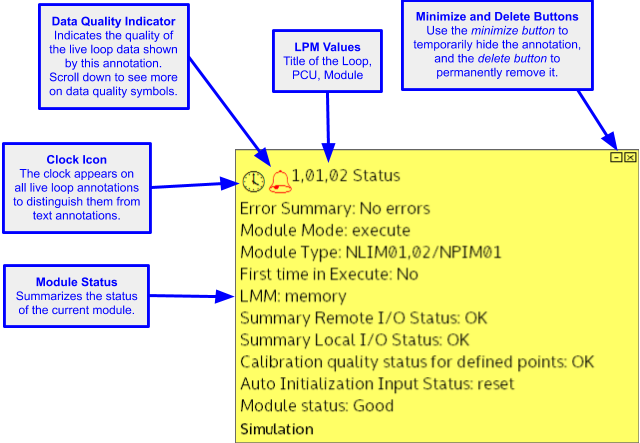
Annotations showing module status
Interpreting symbols on live loop annotations
You may see some of the following symbols/data quality indicators in your live loop annotations:
| Successful data fetch | |
| Error | |
| Bad quality | |
| Alarm | |
| Info - the CIUMon that you are using is connected to an SPM, which can only fetch data from the PCU it is connected to. The data you are requesting is from a different PCU. | |
| Blocked - CIUMon is configured to only send data to approved IP addresses. The computer you are currently using is not on the approved list. You will also see "BLOCKED" displayed on the document, if you turn on on-document live data. | |
| H | High |
| L | Low |
| D | Deviation |
| C | Calibration |
| S | Service |
The colors of the symbols is dimmed for stale data.
See also
- Editing live loop annotations
- Creating live loop annotations
- Positioning live loop annotations
- Copying live loop annotations
- Deleting live loop annotations
- Adding a live loop annotation to the watch window
- Changing the appearance of live loop annotations
- Finding a live loop annotation if you forget which document it is on
- Moving a live loop annotation to a different document
- Live Data Options For This Block dialog
- About live loop annotations
- Managing live loop and text annotations in the Annotation Manager
- Importing live loop annotations